Affinity Modelling with Network Properties

Ein Artikel von Dr. Christian Michael Schneider, ehemaliger Mitarbeiter DYMATRIX
Network Theory and its Business Implication – Part 6
The final post of this blog series is about using network properties for modelling affinities. Affinity models are used to predict the likelihood that a customer will buy a certain product. While there is a wide range of possible affinity models, the simplest one is based on a decision tree with transaction data as input. Transaction data usually include number and value of already purchased products as well as frequency data, like the latest purchase dates. However, the product itself is not part of the model, since product names have no mathematical treatable distance between each other – for example the Levenshtein distance. To overcome this issue a variable can be created for each product type (e.g. product A – number of sales; product B – number of sales; …), but this leads to overfitting. Moreover, this is not practical for a large number of different products.
A smarter way to solve this issue is to use a metric from a product network. Let’s take the sample product network from Part 1 of this blog series:
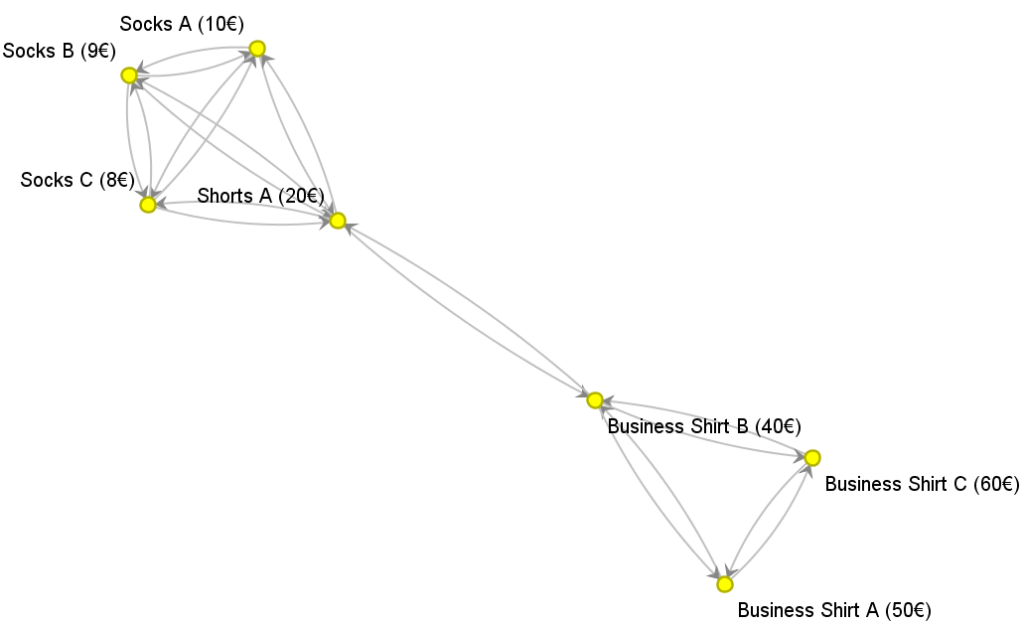
One possible metric is the number of out- and ingoing edges for each product. In this case the value ranges from 2 (Business Shirt A and C) to 4 (Shorts A). Now one could use the maximum number of outgoing edges of all bought products as a predictor for a customer’s affinity. While this value is a local network metric (often called in- and out-degree), there are other (more interesting) global network metrics like average and maximum distance of a product in the network. In this example, the maximum distance – the maximum number of products between two products – is one (Shorts A and Business Shirt B) and two (for all others). While these two metrics only have two distinct values, the average distance distinguishes the products more accurate. The average distance is 7/6 for Business Shirt A and C, 1/2 for Business Shirt B, 1/3 for Shorts A, and 5/6 for Socks C, B and C. This value can be interpreted as a centrality measure, the smaller the average distance, the more central the product. Consequently, Shorts A is the central product.
Now this value can be used to enrich an affinity model to predict the likelihood to by a specific product in the future. In fact, network properties are very good predictors in affinity models, especially if customer information is limited (e.g. in case of new or inactive customers).
With this teaser I am closing this blog series about network theory hoping that you have enjoyed the blog. If you have further questions, comments, or if you are interested in applying such techniques on your Business, feel free to contact our team.
Part 0. Network Theory and its Business Implication
Part 1. Identifying relevant business networks
Part 2. Is your customer or your customers’ friend more important for your business?
Part 3. How to identify product groups?
Part 4. How to keep your company happy and healthy?
Part 5. How to get customer (friendship) networks?
Part 6. Affinity modelling with network properties