Guaranteed 10% higher Gross Margin by Coupon Optimisation?

Ein Artikel von Erik Obermeier, ehemaliger Mitarbeiter DYMATRIX
As I promised in my recent post, today, I present to you an astonishing use case where we applied predictive analysis to gain substantial added value for customers. Today’s post is about an online and mail order business. The company provided the vast majority of addresses with coupons valued from 10 Euros and more in their mail and email campaigns. A wide range of buyers redeemed the coupons, i.e. they are also a drag on the Gross Margin. We implemented a self-developed predictive analysis model, which we call “Uplift Model” to determine who should receive a coupon to increase the overall Gross Margin of the campaigns ran by the company’s campaign management system.

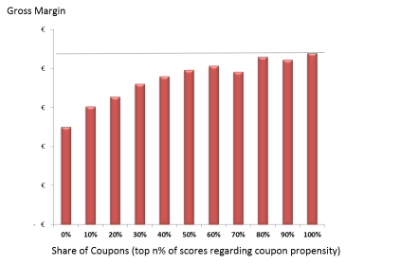
Prior to our implementation the utilised model was what we call “Incremental Response”, i.e. a regression-based uplift model founded on Victor Lo, 2002. As you can see, the regression-based model delivered that the maximum Gross Margin was achieved if all participants of the campaign received a coupon.

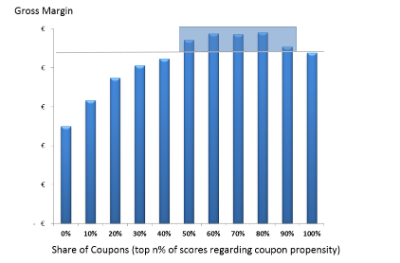
We implemented our tree-based uplift model founded on Radcliff/Surry 2011 and Rzepakowski / Jaroszewicz 2012.
The results are awesome! Now, our customer sends coupons to the precious 60% of the participants and no coupons to the remaining participants. Our customer now generates roughly 10% incremental Gross Margin with the very same campaigns, which equates circa € 200,000. How is this doable?

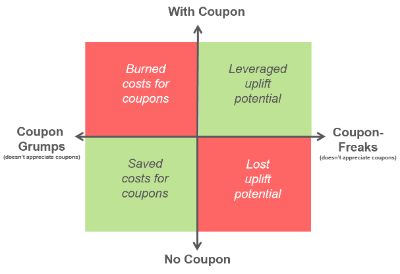
As a matter of fact there are at least 4 types of categories with regards to coupons in your audience: I.e. you should not burn costs for coupons, if your customer doesn’t appreciate coupons and you should not miss to provide coupons to people who only buy with coupon. Vice versa you generate additional Gross Margin if you save costs for coupons if you do not send them to “Coupon Grumps” and you lift all potential additional revenue if you send them to people who only buy with a coupon.
To set up the solution in your environment all you need to do is to:
- define an appropriate set of test data (circa 50,000 to 100,000 per group with and without coupon),
- define the input variables (historic behavior regarding coupons, purchase data, non-purchase data) and
- apply the uplift model we developed.

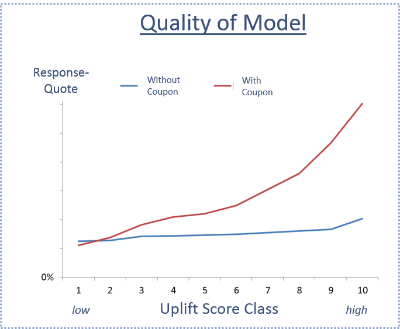
The quality of the model has to be confirmed. As you can see the Response Quote (= purchase) for the lower uplift scores is worse for offers including a coupon, which just reiterates that the 4 categories outlined above exist.
The final step is to apply the scores per addressee to your campaign.
To further improve the Gross Margin, advanced steps include to apply the type of channel (mail, email, push, SMS, etc.), the value of the coupon (€ 10,€ 20,…), cost of delivery and more to the model.
This is a great example how you can achieve incremental profit for your business by applying predictive analytics. The value is not only in the additional Gross Margin as obviously customer satisfaction is going to increase and your brand recognition will be improved. As you well imagine, you are not limited to the coupon case . Please check out my future posts for more use cases.
The implementation of this great approach is quick and we even offer it „as a Service“ and to price it performance-based. If you want to learn more about the details and how to apply it in your environment, you can contact us anytime.


